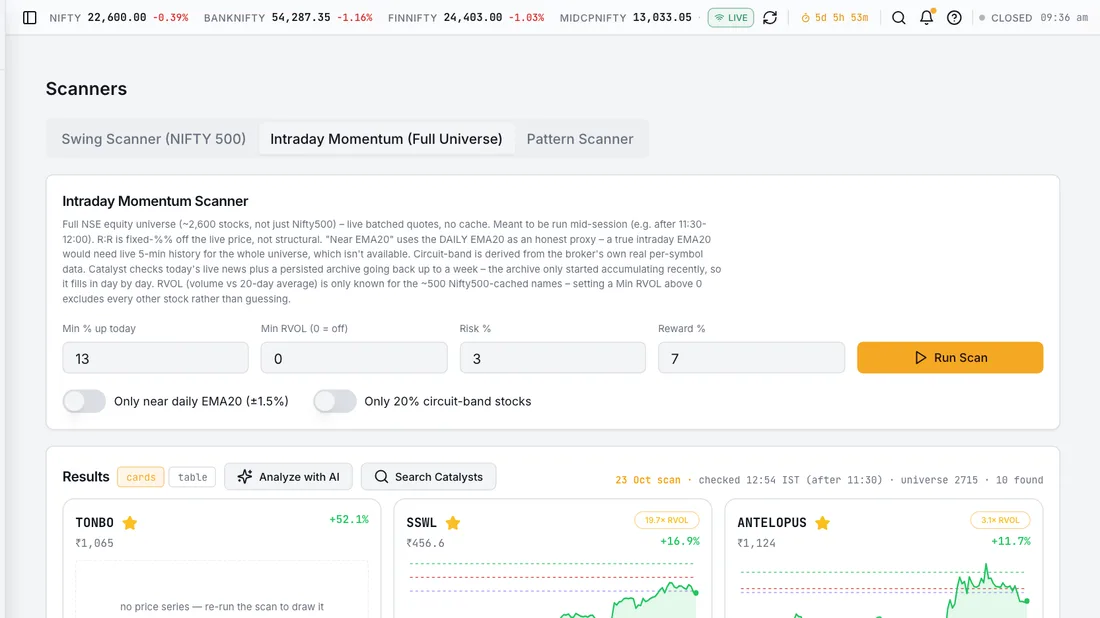
Screeners & scanners

Stock screeners for the NSE and BSE – breakouts, IPO bases and swing setups

Ten screeners over a local price lake of ~3,350 Indian symbols. Each returns a plan – entry, stop, target – not a bare list of tickers.

Market Scanner – Screens the most-active Indian equities on price, percentage change, RSI, relative volume and traded volume, with preset theses for momentum, volume shocks and oversold conditions. Built on a local daily price lake covering roughly 3,350 symbols.
Breakout Scanner – Finds pole-and-flag breakouts across the Nifty 500 – a measured advance, a contracting flag, then a volume-confirmed break – and attaches an ATR-based risk plan with entry, stop and targets.
Swing Scanner – Swing-trading candidates gated by market regime, with structure (break of structure and change of character), relative strength versus NIFTY, and a sized position plan.

Graded, not listed

A conviction bucket per setup. Half-qualifying names show as a watch.

A plan, not a ticker

Entry, ATR-derived stop, targets from the same risk unit.

Contraction, measured

Pullbacks tightening as volume dries up – measured before the breakout bar.

Screeners & scanners

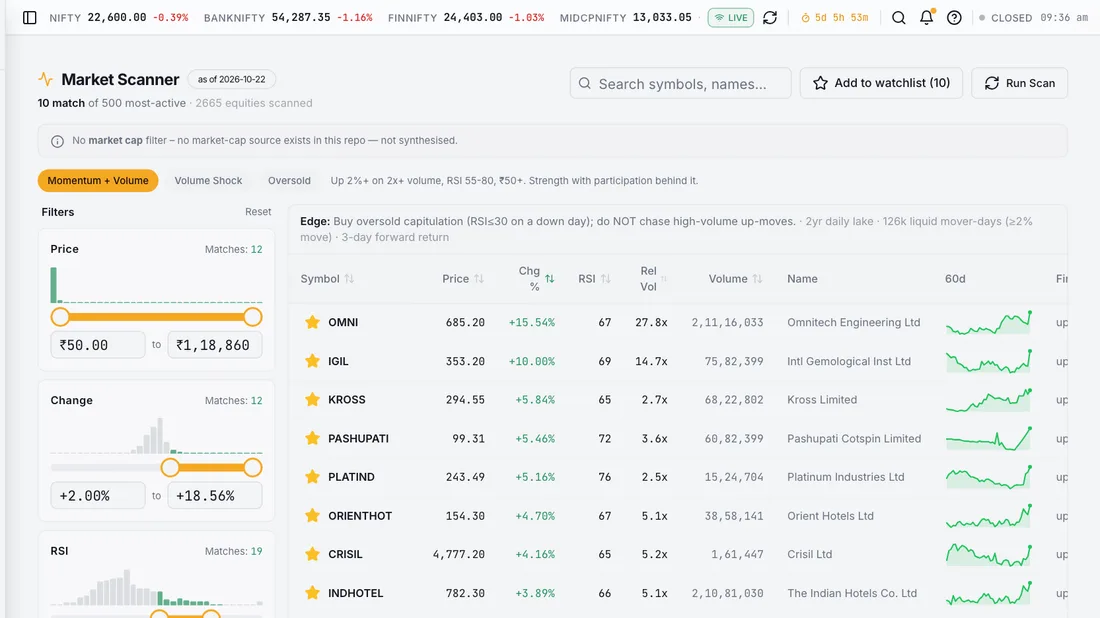
Market Scanner – Screens the most-active Indian equities on price, percentage change, RSI, relative volume and traded volume, with preset theses for momentum, volume shocks and oversold conditions. Built on a local daily price lake covering roughly 3,350 symbols.

Market Scanner

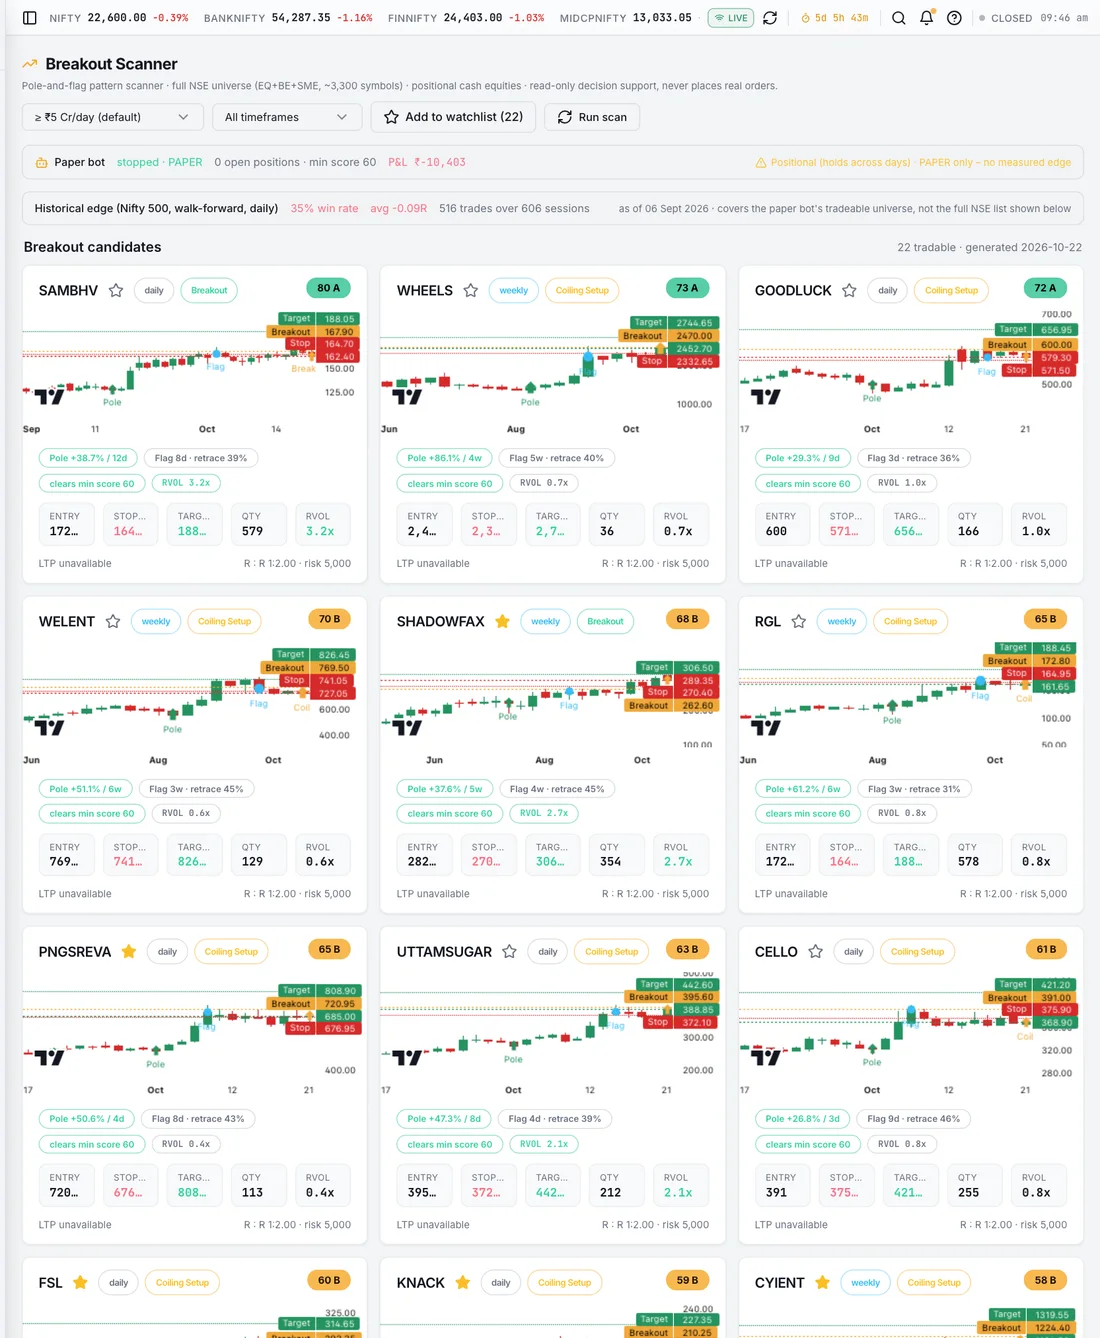
Breakout Scanner – Finds pole-and-flag breakouts across the Nifty 500 – a measured advance, a contracting flag, then a volume-confirmed break – and attaches an ATR-based risk plan with entry, stop and targets.

Breakout Scanner

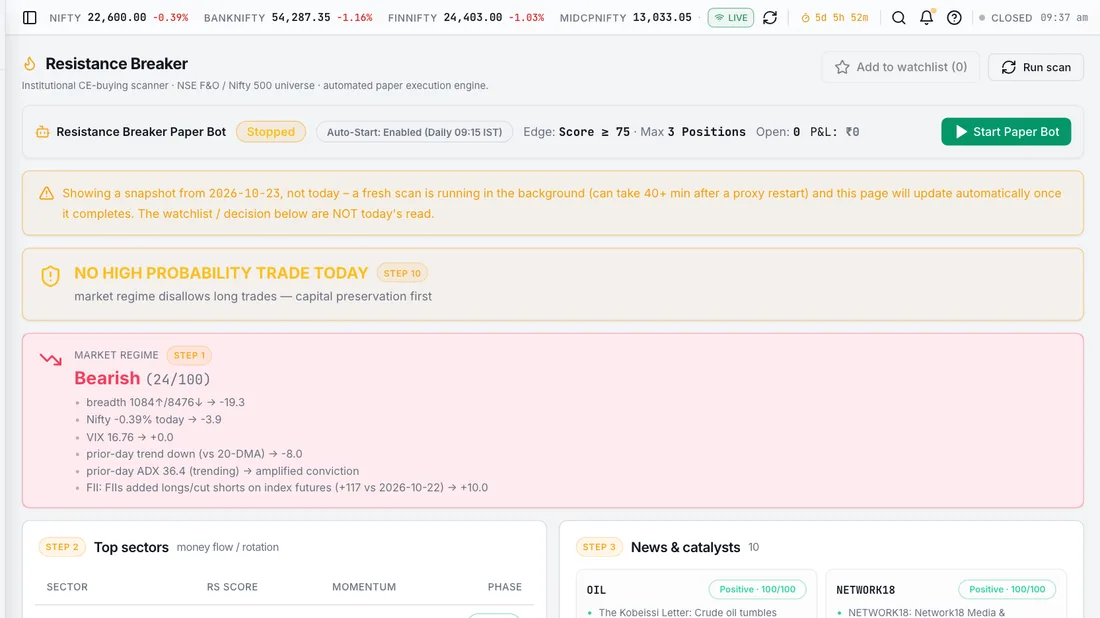
Swing Scanner – Swing-trading candidates gated by market regime, with structure (break of structure and change of character), relative strength versus NIFTY, and a sized position plan.

Swing Scanner

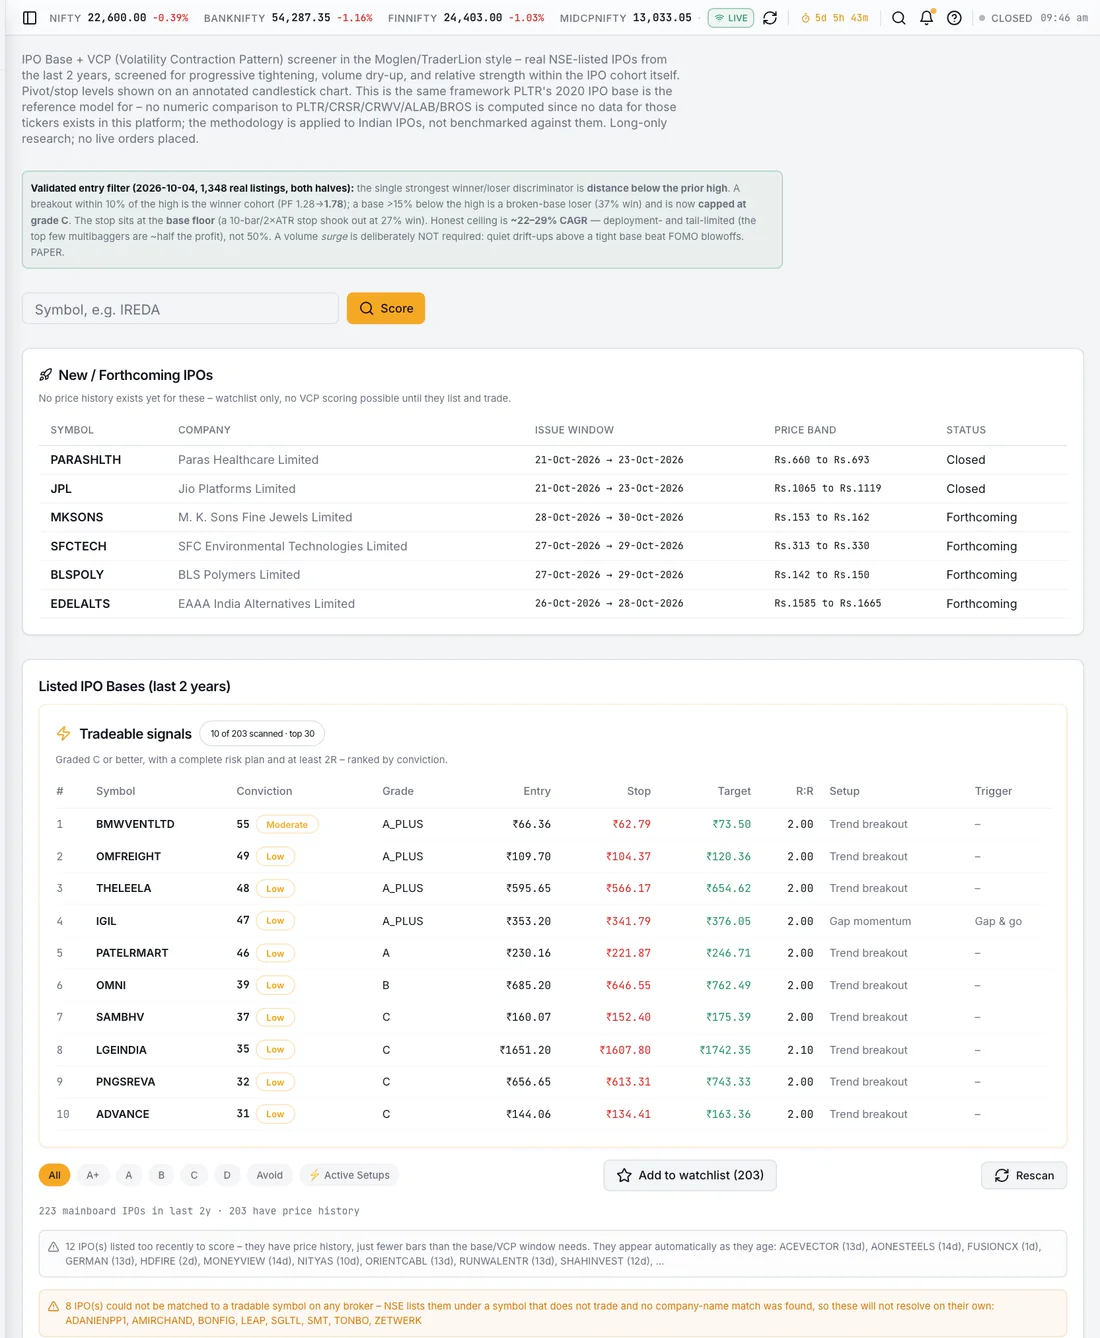
IPO Base + VCP Screener – Screens companies that listed in the last two years for IPO bases and volatility contraction patterns (VCP), grading each on base tightness, volume dry-up, relative strength and quarter-on-quarter fundamentals.
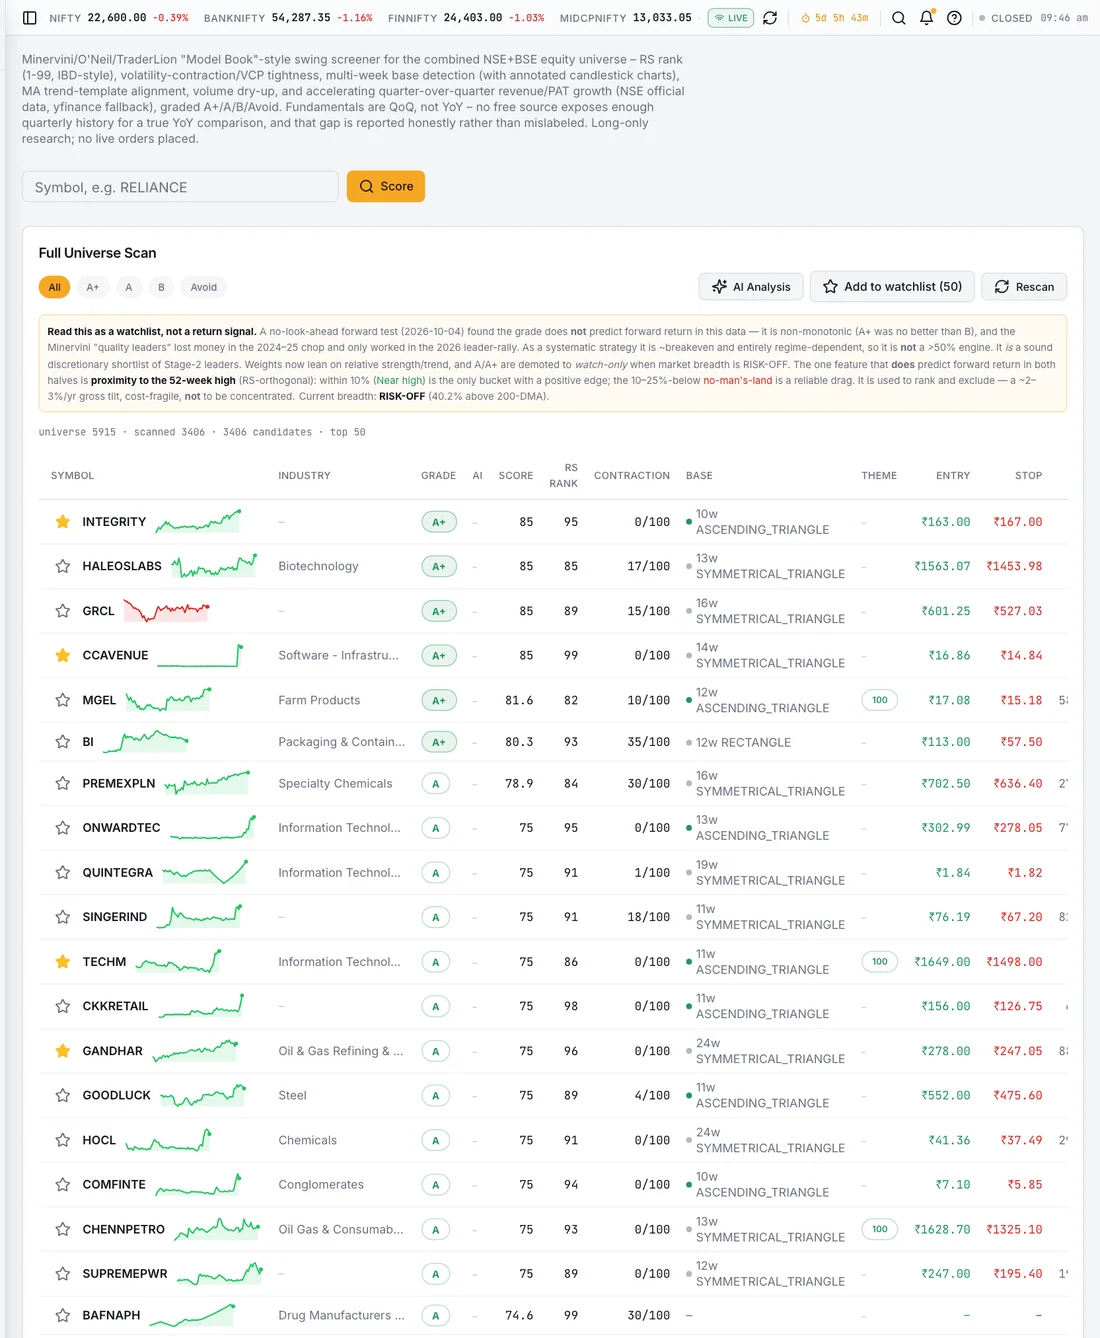
IPO Base + VCP Screener

Model Book Screener – A Minervini and O'Neil style screen for Indian equities across the NSE and BSE universe: base structure, moving-average alignment, relative-strength rank and real quarterly fundamentals.
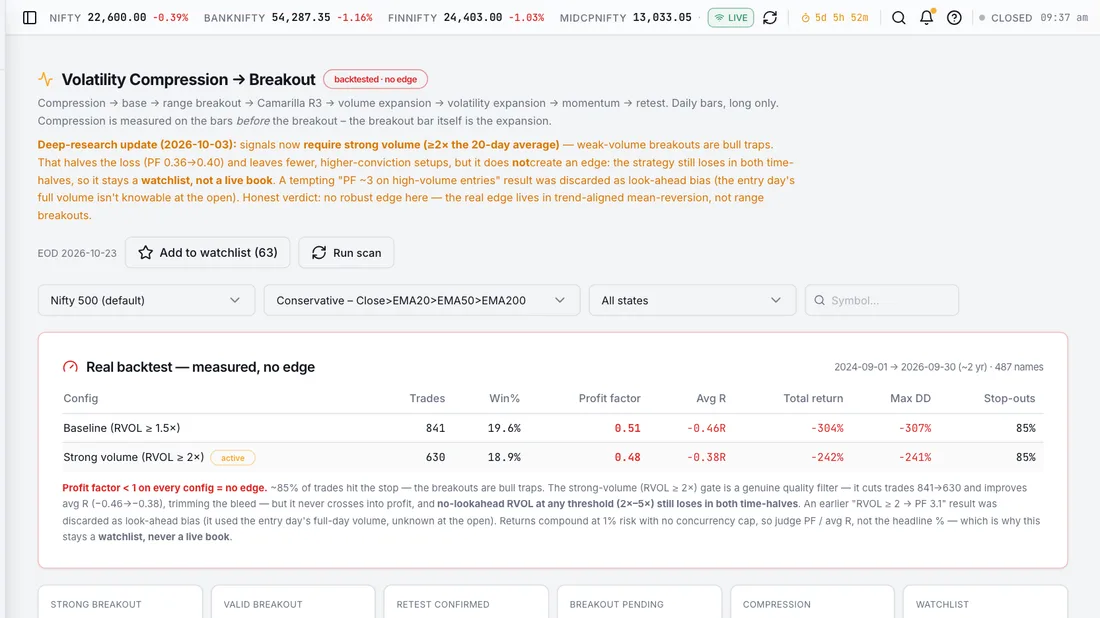
Model Book Screener

Volatility Breakout – Compression into expansion: measures how quiet a stock was BEFORE the breakout bar, then tracks the break. Published as a research tool – its two-year backtest was negative, and that result is stated on the page rather than hidden.
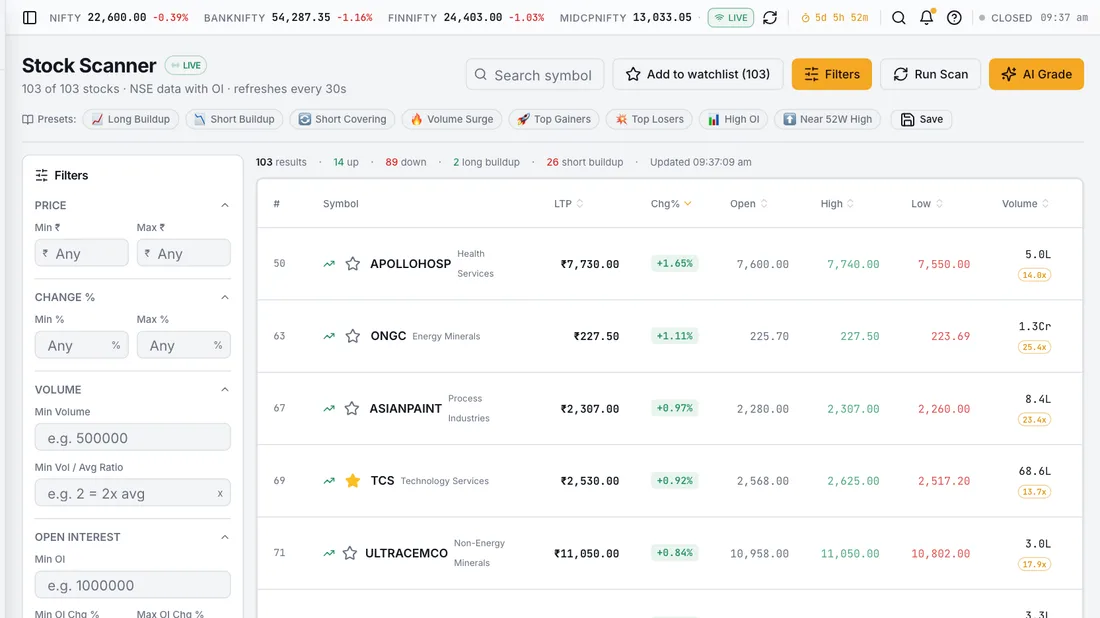
Volatility Breakout

Stock Scanner – Support and resistance proximity across the Nifty 500, for locating stocks trading into a level rather than in open space.

Stock Scanner

Support & Resistance Breakers – Two scanners for level breaks – support failures on the short side and resistance reclaims on the long side, each with its own risk plan.
Support & Resistance Breakers

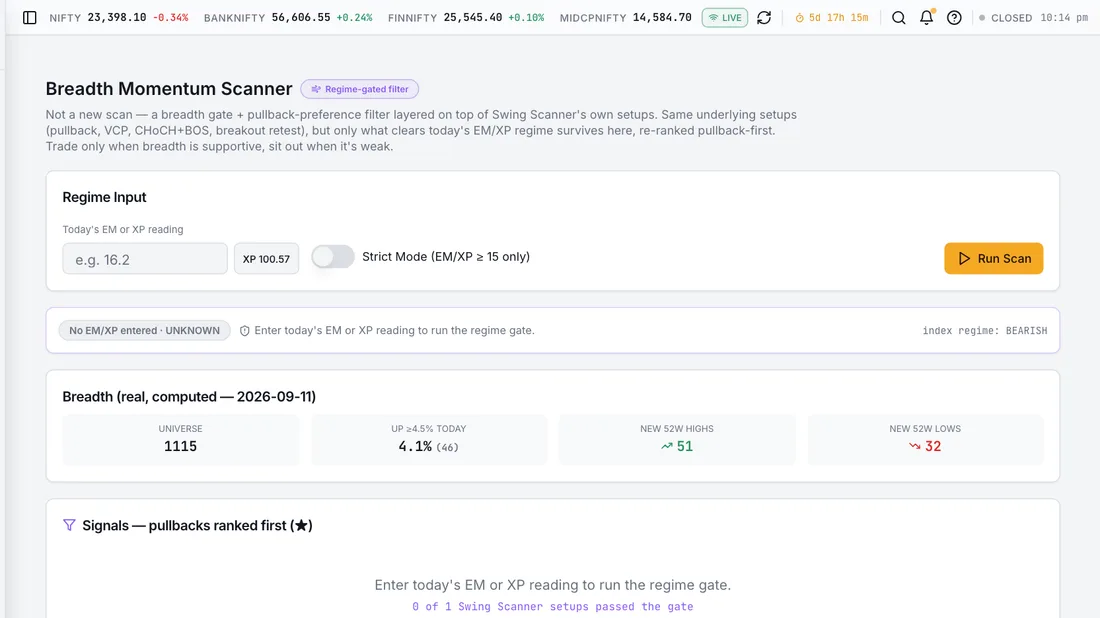
Breadth Momentum – Market breadth as a momentum series – what share of the universe sits above its 20, 50 and 200-day moving averages, and how that is trending.
Breadth Momentum

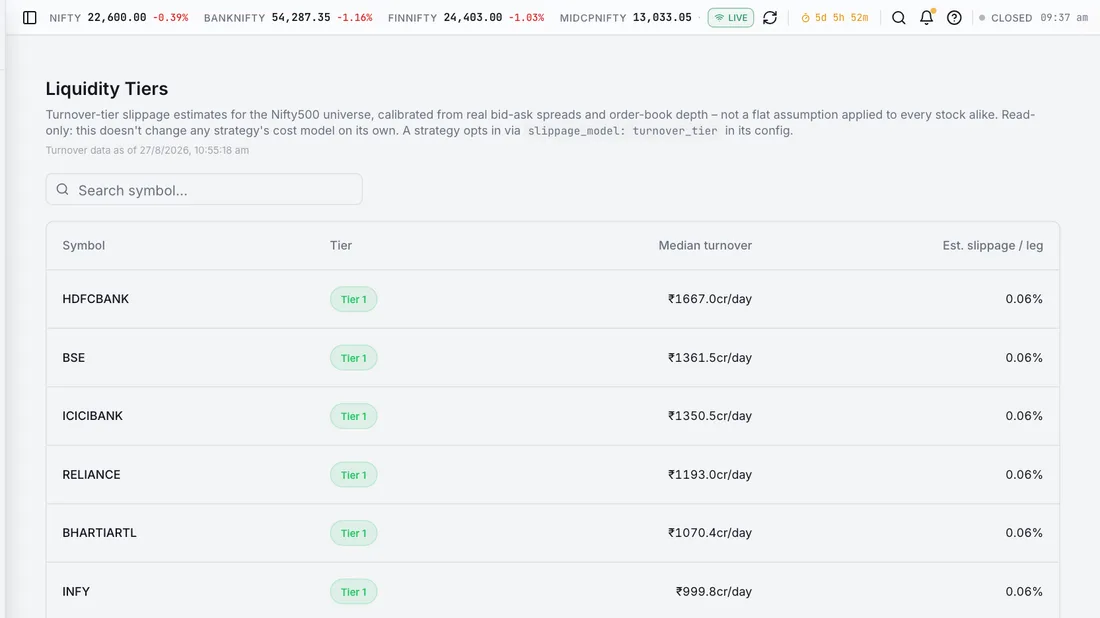
Liquidity Tiers – Ranks the universe by turnover so position size can be checked against what a name actually trades, before a plan assumes liquidity that is not there.

Liquidity Tiers

swipe to browse

Common questions

What is a VCP?

A volatility contraction pattern: successive pullbacks get shallower while volume dries up. It must be measured before the breakout bar, since that bar is by definition an expansion.

Do screeners give entry and stop levels?

Yes. Every tradeable setup carries an entry, an ATR- and structure-derived stop, and targets computed from that risk unit. Setups below a minimum reward-to-risk are filtered out.

How many stocks are scanned?

Roughly 3,350 NSE and BSE symbols, read from a local data lake so every screener sees the same history.

Try it on live market data

Paper mode first, against live prices.

Get started