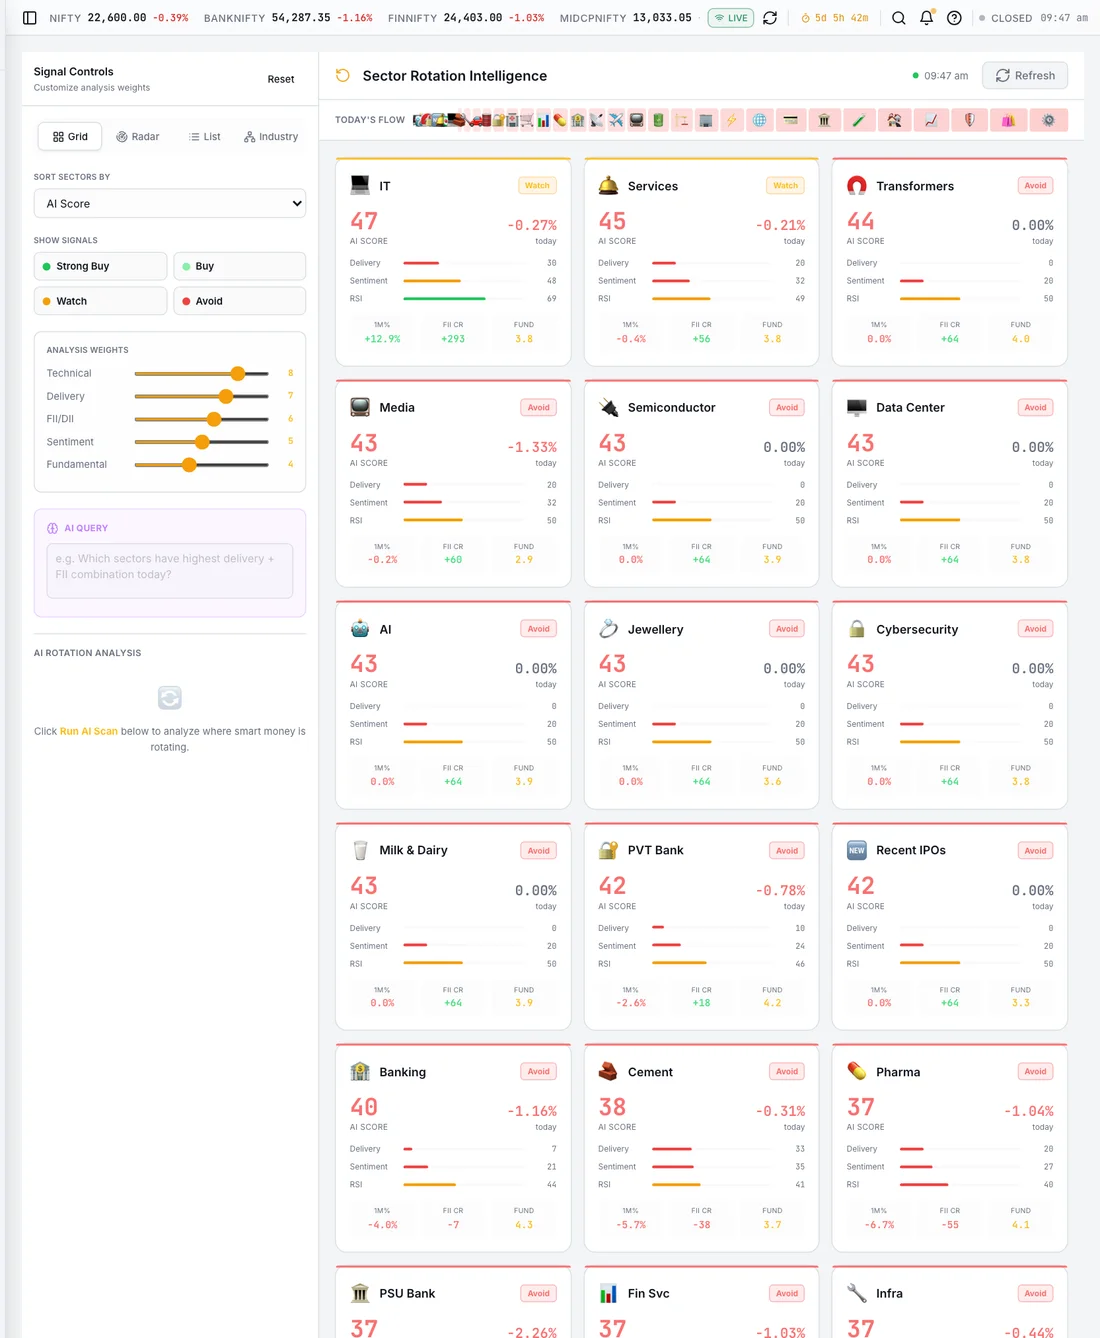

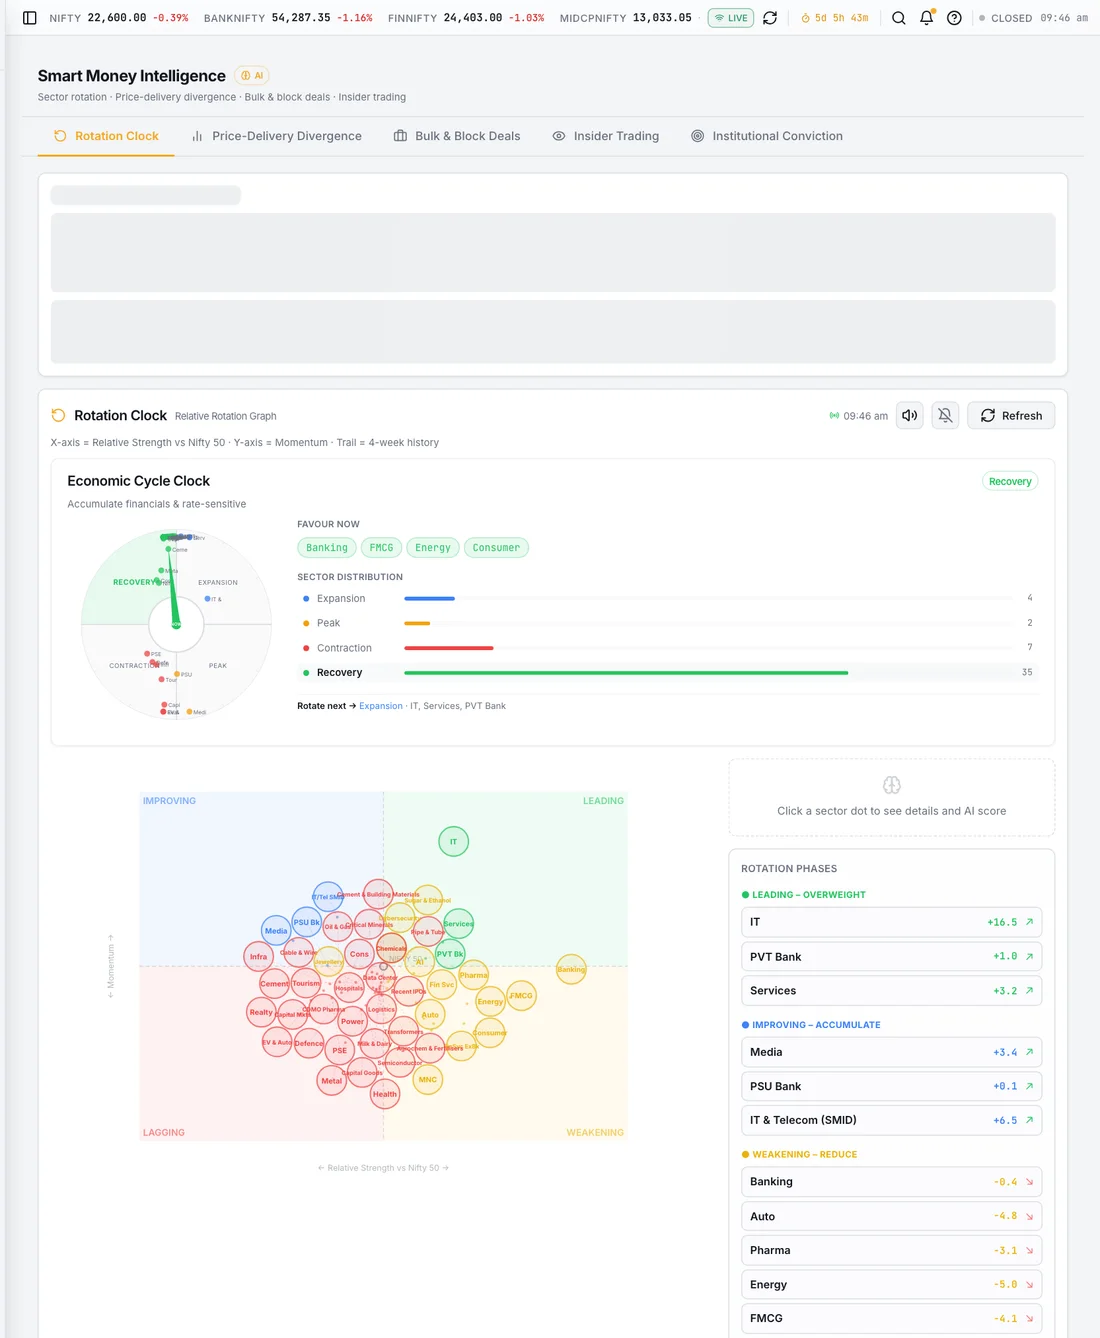
Four quadrants, one view
Leading, Weakening, Lagging, Improving – every sector placed, with its trail.
Strength and momentum
Relative strength against NIFTY on one axis, the momentum of that strength on the other.
Beyond the 28 indices
Granular industry baskets built from ~3,350 classified symbols, not just published sector indices.
Market intelligence
Global Macro Radar
Smart Money Intelligence
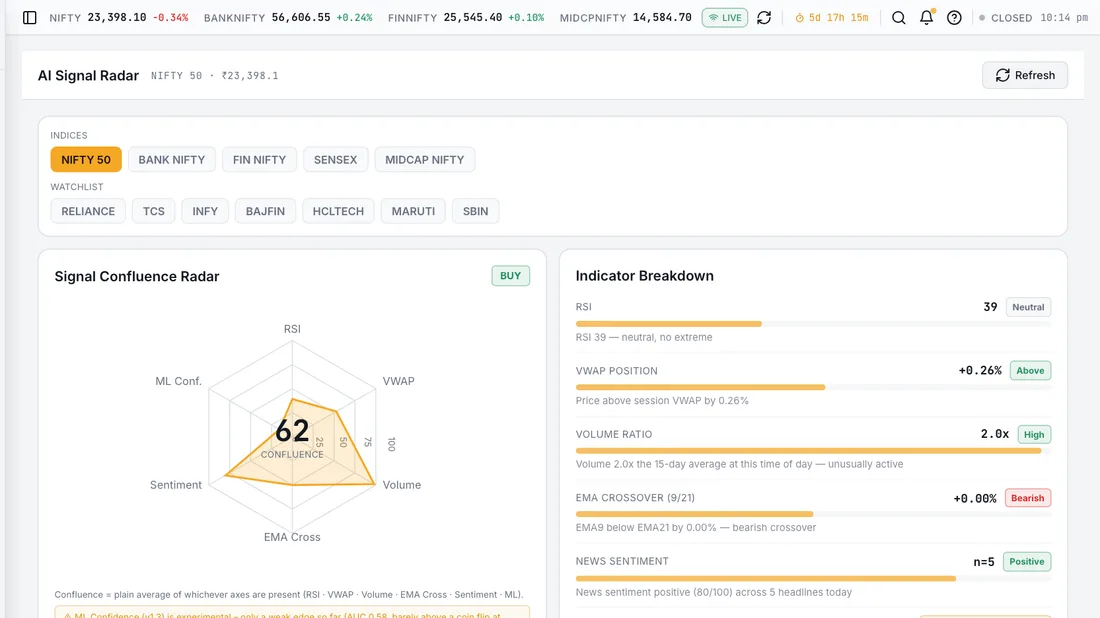
AI Signal Radar
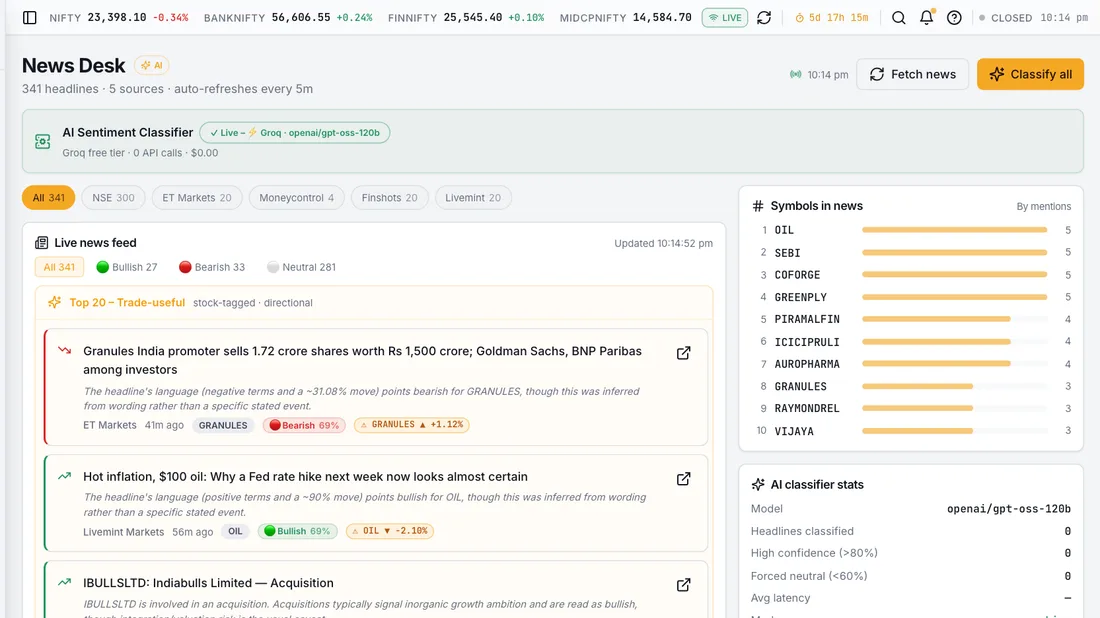
News Desk & Catalyst Engine
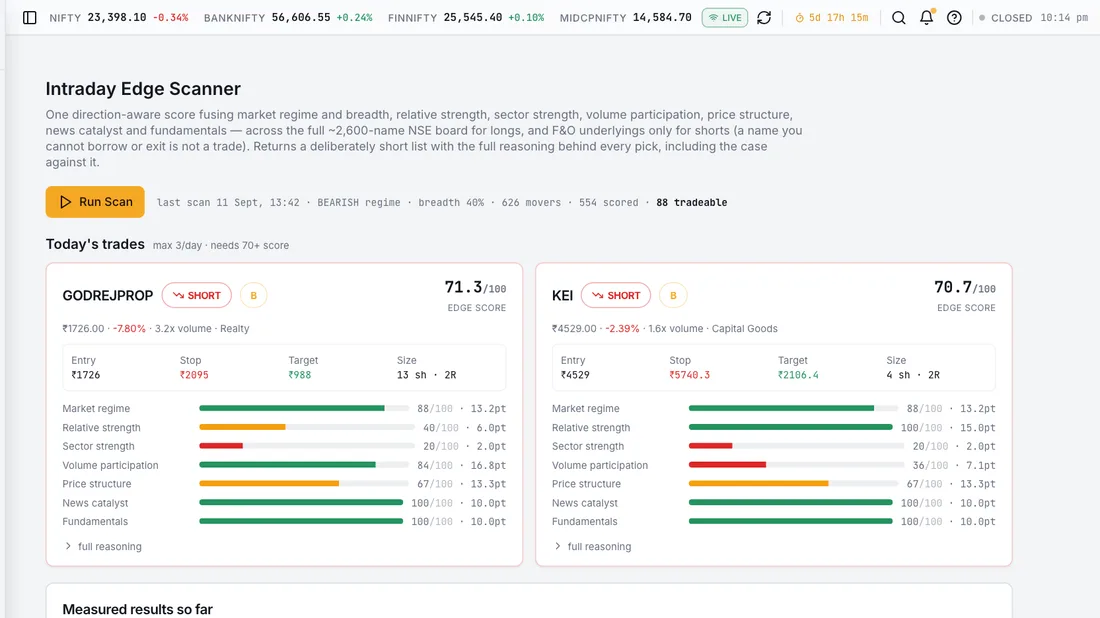
Intraday Edge
Global Investing
swipe to browse
Common questions
What is a Relative Rotation Graph?
A chart that places each sector by its relative strength against a benchmark (here the NIFTY 50) on the horizontal axis, and the momentum of that relative strength on the vertical. The four quadrants – Leading, Weakening, Lagging, Improving – describe where a sector is in its rotation cycle, and the tail behind each point shows how it got there.
How do I read the four quadrants?
Leading (top right) is outperforming with momentum still positive. Weakening (bottom right) is still outperforming but losing momentum. Lagging (bottom left) is underperforming with negative momentum. Improving (top left) is still underperforming but momentum has turned. Sectors generally travel clockwise, so Improving often precedes Leading.
Is there a free relative rotation graph for Indian markets?
Orbis includes one. It covers the published NSE sector indices plus custom thematic baskets – defence, capital goods, semiconductors, data centres – and a granular industry tier derived from roughly 3,350 classified NSE and BSE symbols, which is far more detail than the 28 official sector indices alone.
What benchmark is used, and over what period?
The NIFTY 50. Relative strength is the sector's excess return over the benchmark across a 30-session window, and momentum is the one-day excess return, so a point's position reflects a month of relative performance while its latest move reflects the most recent session.
How is this different from a sector performance table?
A performance table ranks sectors by return. An RRG shows direction of travel: a sector can be down on the day and still be improving relative to the index, or up and already weakening. Rotation is about the second derivative, which a simple ranking cannot express.