Options analytics

HDFC Bank (HDFCBANK) max pain – calculated live from the full option chain

Max pain for HDFC Bank is the strike at which the largest rupee value of open HDFCBANK call and put contracts would expire worthless – the expiry level that hurts option buyers the most. Orbis computes it live from the complete stock option chain, strike by strike, beside the open interest, change in OI and put-call ratio it is derived from. HDFC Bank is a private-sector banking name in the NSE F&O segment.

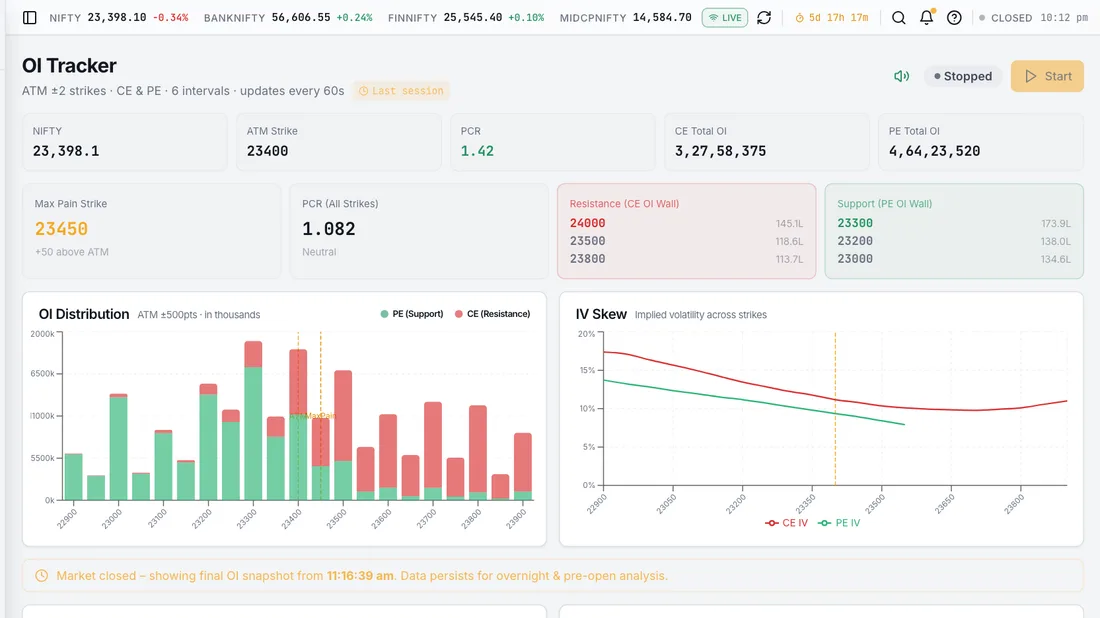
Option Chain & OI Tracker – The live option chain for NIFTY, BANKNIFTY, FINNIFTY and SENSEX with strike-by-strike open interest (OI), change in open interest, implied volatility (IV), IV rank and the option Greeks. Tracks max pain and the put-call ratio (PCR) through the session.
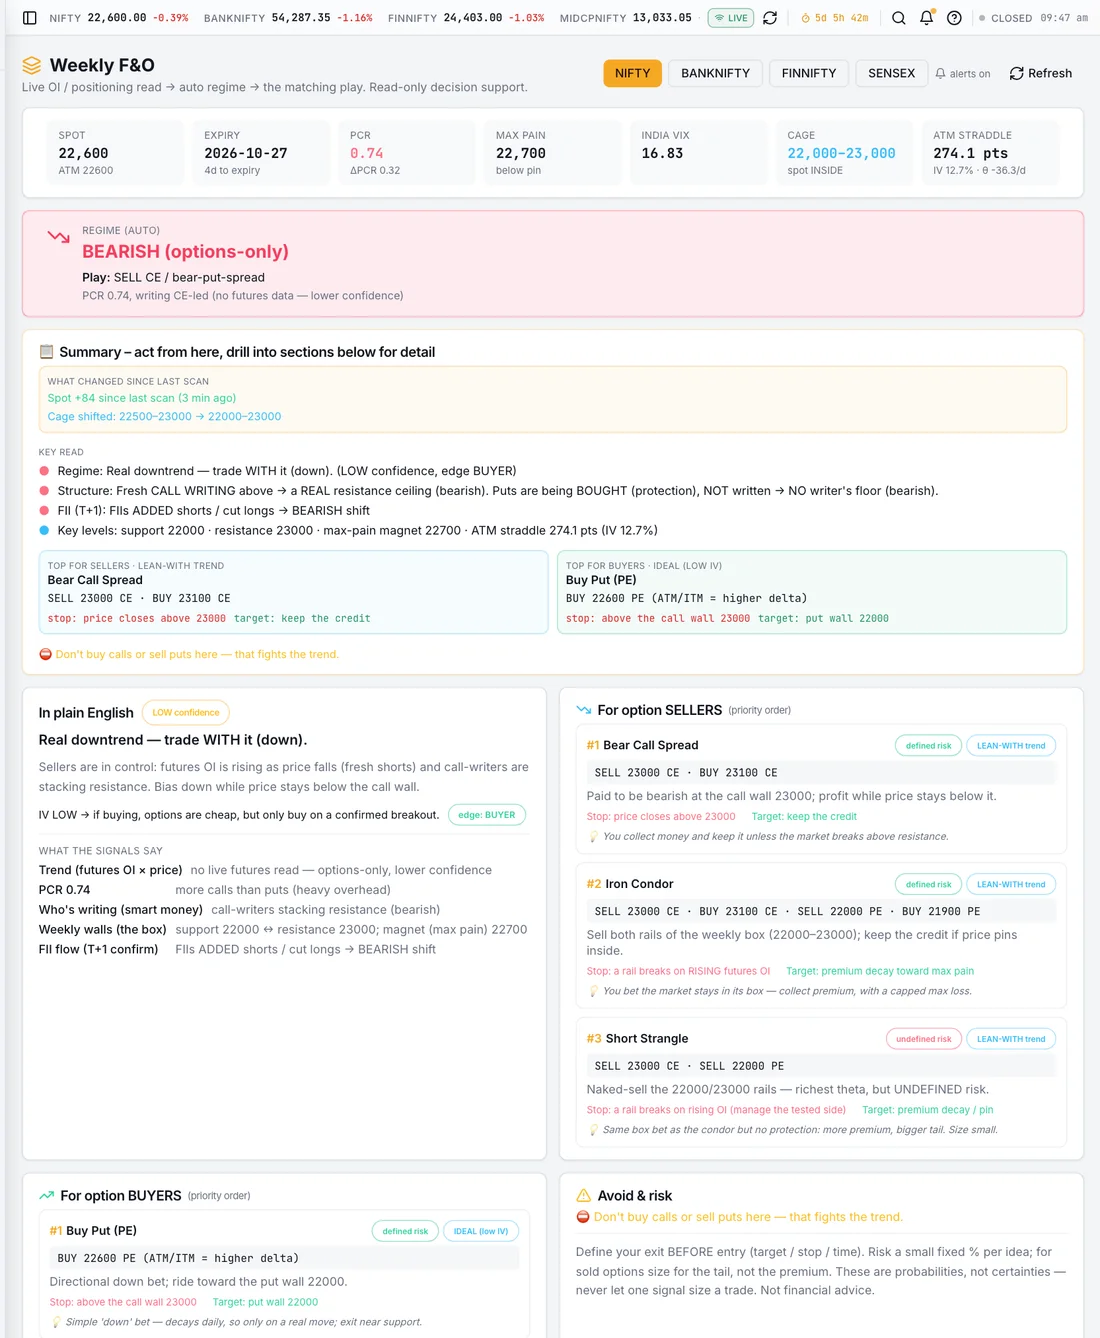
Weekly F&O Positioning – Reads the weekly futures and options build-up into a single regime view – where writers are positioned, which strikes are defended, and how that has shifted since the previous expiry.
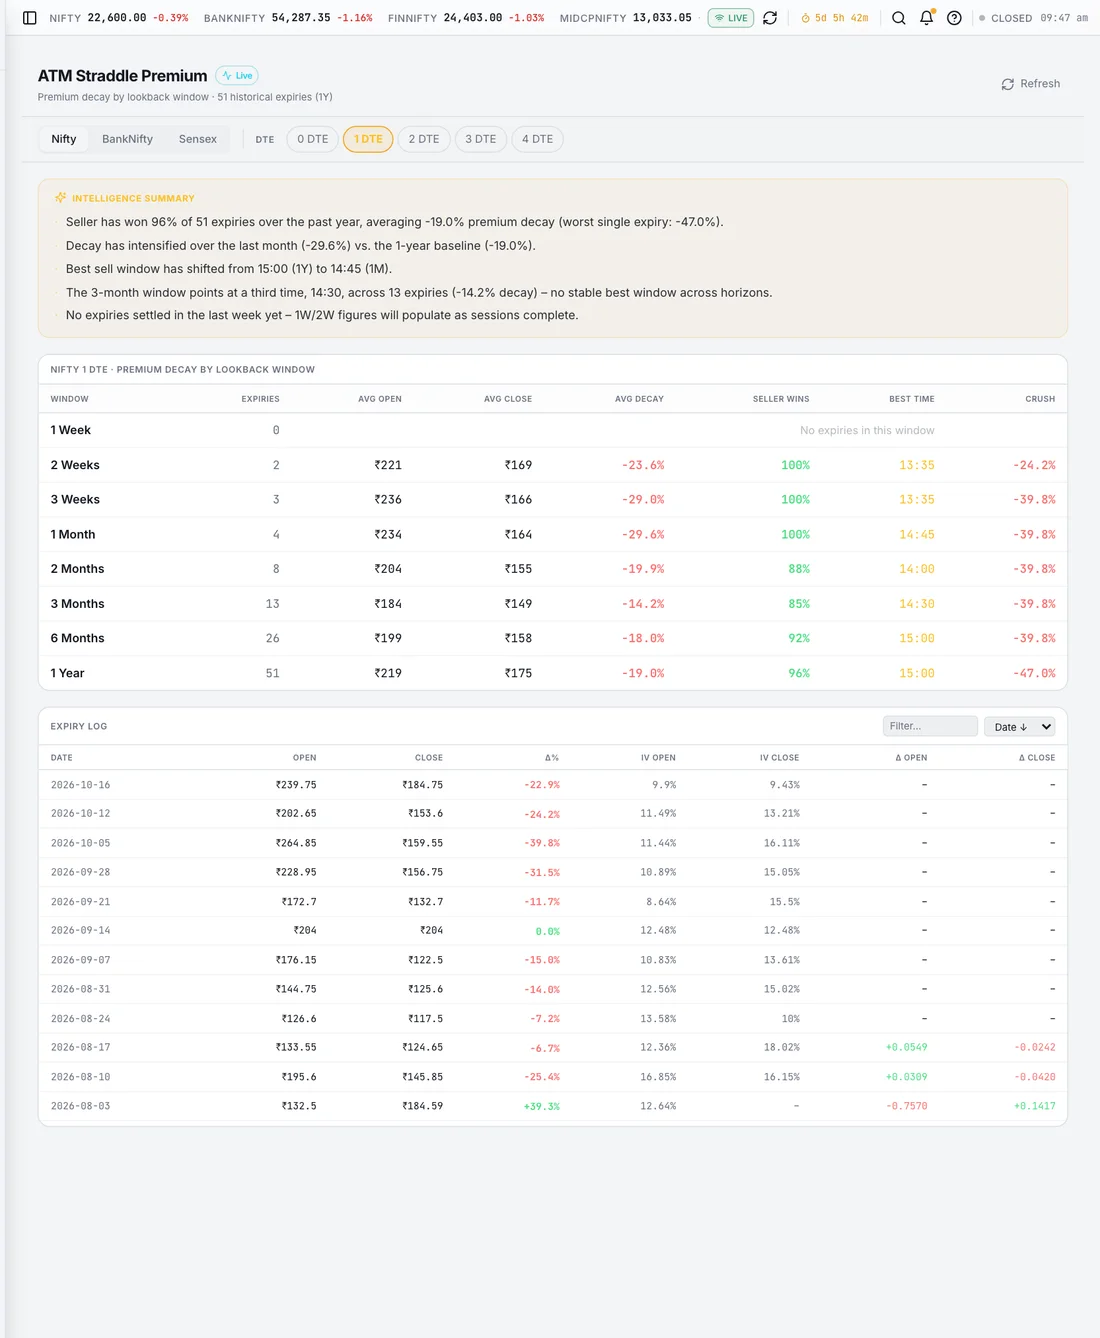
Straddle Premium – The at-the-money straddle premium for each index tracked across 0 to 4 days to expiry (DTE), with a year of implied volatility and delta history behind it.

Computed from real HDFCBANK OI

Every HDFCBANK strike's call and put open interest, summed into a loss curve – the minimum is max pain.

The whole chain behind it

Strike-by-strike OI, change in OI, IV and Greeks for HDFCBANK – the inputs, not just the answer.

Read with PCR, not alone

HDFCBANK max pain beside its put-call ratio and IV context – one number in isolation is a trivia fact, not a read.

Options & derivatives

Option Chain & OI Tracker – The live option chain for NIFTY, BANKNIFTY, FINNIFTY and SENSEX with strike-by-strike open interest (OI), change in open interest, implied volatility (IV), IV rank and the option Greeks. Tracks max pain and the put-call ratio (PCR) through the session.

Option Chain & OI Tracker

Weekly F&O Positioning – Reads the weekly futures and options build-up into a single regime view – where writers are positioned, which strikes are defended, and how that has shifted since the previous expiry.

Weekly F&O Positioning

Straddle Premium – The at-the-money straddle premium for each index tracked across 0 to 4 days to expiry (DTE), with a year of implied volatility and delta history behind it.
Straddle Premium

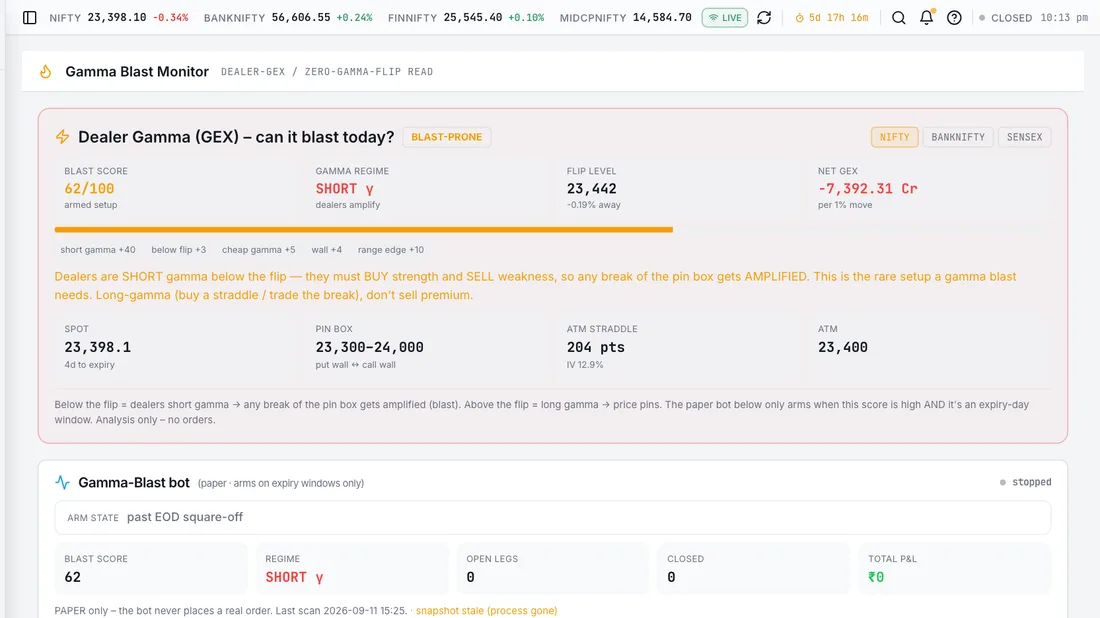
Gamma Blast Monitor – A dealer gamma exposure (GEX) and zero-gamma-flip read for expiry-day conditions, with alerts when the blast score crosses its threshold.

Gamma Blast Monitor

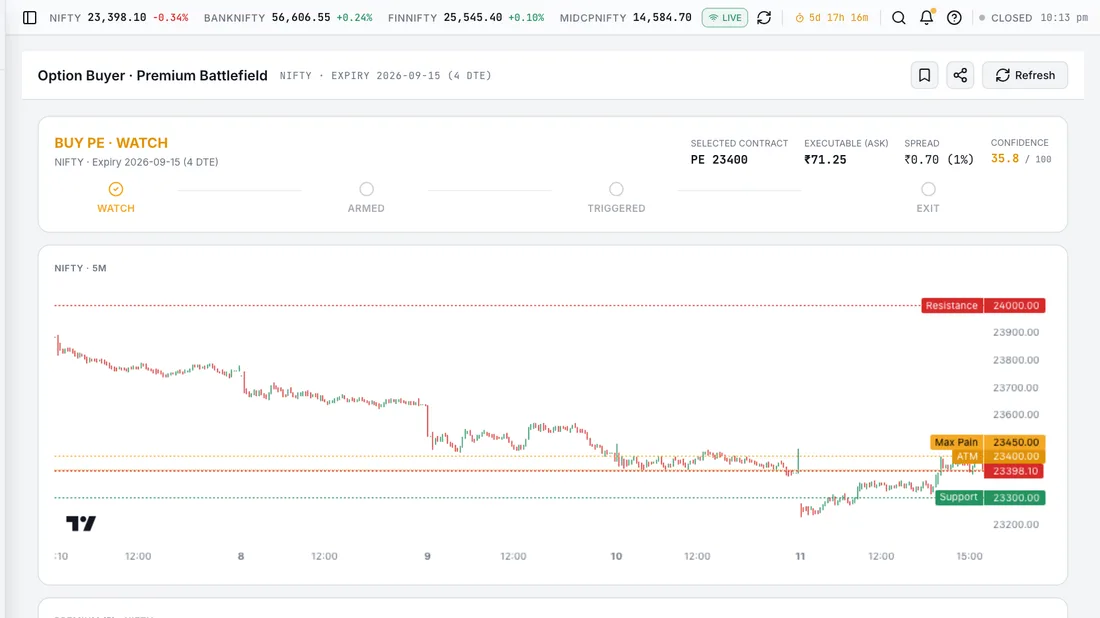
Option Buyer Battlefield – A single confidence score for option buyers, weighted from wall proximity, gamma exposure, put-call ratio trend, IV percentile and straddle expansion.
Option Buyer Battlefield

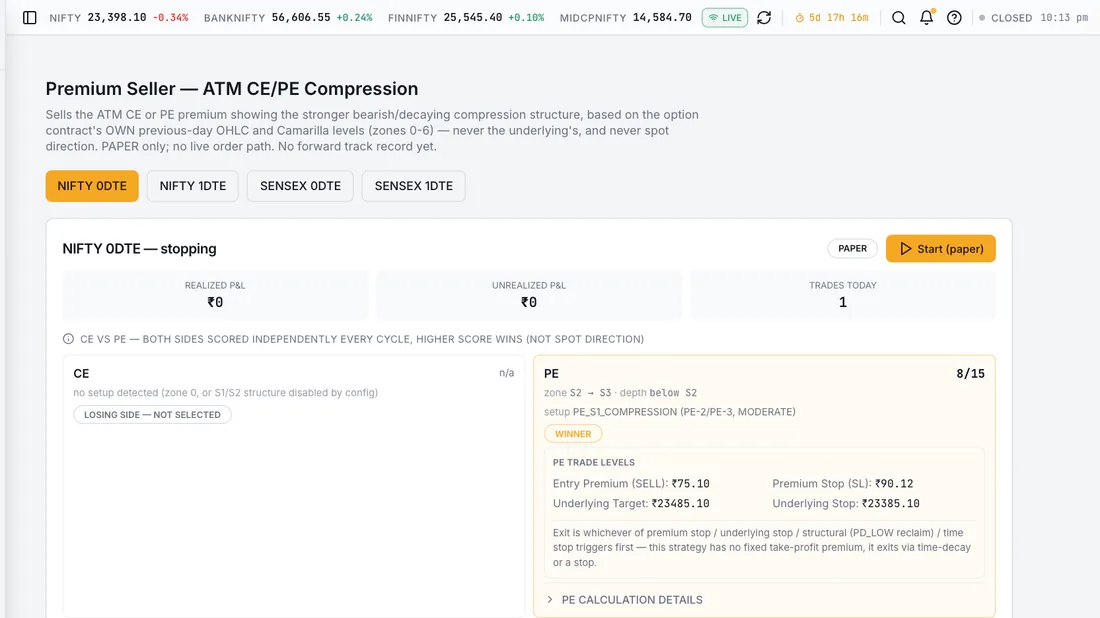
Premium Seller – An option-selling workspace for at-the-money premium on NIFTY and SENSEX, built on each contract's own OHLC and Camarilla structure. Paper mode only.

Premium Seller

swipe to browse

Common questions

What is HDFC Bank max pain today?

It changes with every shift in HDFCBANK open interest, which is why Orbis computes it live from the chain rather than publishing a snapshot that goes stale by the next session. Open the option chain tool for the current value, the strike-wise OI behind it, and how it has moved through the day.

How is max pain calculated for HDFCBANK?

Take every listed HDFCBANK strike in turn, assume expiry settles exactly there, and total what all outstanding calls and puts would then pay out to buyers. The strike where that total payout is smallest is max pain – the point of maximum aggregate loss for option buyers, and by symmetry maximum retention for writers.

Is HDFCBANK max pain a reliable trading signal?

Treat it as positioning context, not a prediction. The "price gravitates to max pain" idea assumes writer hedging dominates the tape into expiry, which is sometimes true and often not – especially in single stocks, where one large institutional position can move the whole OI profile overnight. Orbis shows it beside PCR, OI change and IV so it is read as one input among several, with its limitations visible.

Try it on live market data

Paper mode first, against live prices.

Get started